
Every November I run the same small experiment. A colleague on my team pulls the Black Friday tech deals that land in my inbox, and I pull up the price history for each one before anybody gets excited. Most years, somewhere around a third of the “doorbusters” turn out to be the regular price wearing a red tag. This year the stakes are higher, because the memory shortage has pushed a lot of sticker prices up and made every “was” number a little less trustworthy.
The good news is that you do not need to be a deal-hunting obsessive to avoid getting fooled. You need a free price-history tool, ten minutes, and a rule for how low is low enough. Here is the exact routine I use, plus the short list of gear I am watching for a genuine drop between now and Cyber Monday.
The short list I am tracking this week
These are the products I would happily buy at the right price and would happily skip at the wrong one. I am not telling you to buy them today. I am telling you to put them on a watchlist and let the chart do the talking.
- Noise-canceling over-ears: Sony WH-1000XM5, which has a long, readable price history.
- Earbuds: Apple AirPods Pro 3 for iPhone households, and Anker Soundcore Space One for everyone who wants a budget alternative.
- Portable storage: Samsung T7 Shield Portable SSD.
- Desk gear: Logitech MX Master 3S and Logitech MX Keys S.
- Power: Anker 735 Charger (Nano II 65W).
- Amazon’s own devices: Fire TV Stick 4K Max, Echo Dot and Kindle Paperwhite.
Notice what is missing: RAM kits, bare SSDs and anything else that has been swinging wildly with the memory market. I covered why in my storage squeeze field guide, and the short version is that a price chart for those parts is mostly a record of the shortage, not of discounts.
What a fake discount actually looks like
Retail has a vocabulary for making a price feel lower than it is, and Black Friday is the season it gets spoken fluently. Learn to recognize four dialects.
The first is the inflated reference price. The tag says “was $349, now $249,” but the product has spent most of the year at $259. The “was” number is a list price that nobody has actually paid in months. The second is the slow-motion markup, where a price creeps up for two weeks in October and then “drops” back to where it started. The third is the bundle swap: the headline price is real, but the product is a different, cheaper configuration with a nearly identical name. The fourth is the third-party seller special, a flashy price from a marketplace seller that vanishes when you try to check out, or ships from somewhere you would rather not wait on.
None of these is illegal, and most are not even unusual. They are just marketing, and a price chart makes every one of them visible at a glance.
Ten minutes to set up a price tracker

I use two tools and keep them boring. Keepa is a browser extension that adds a price-history chart directly under the product listing on Amazon. CamelCamelCamel is a website where you paste a product link and get a chart plus email alerts. Both are free for the basics, and either one will answer the only question that matters: has this price actually been this high, or this low, before?
Here is the routine, start to finish:
- Install the extension in the browser you actually shop in, then open the product page for something on your list.
- Switch the chart to the longest time range available, not the default few weeks. A one-month chart will happily show you a “deal” that is just a return to normal.
- Turn on the lines for Amazon’s own price and for new third-party offers. The gap between them tells you whether the best price is coming from Amazon or from a marketplace seller.
- Note three numbers: the lowest price in the past year, the typical price over the past three months, and the price today.
- Set an alert for a specific target (more on how to pick it below) and close the tab.
That is the whole system. The reason it works is not the tool, it is the order of operations. You decide what a good price is while you are calm and it is early November, instead of while a countdown timer is ticking in the corner of a product page.
How I read a chart in about fifteen seconds
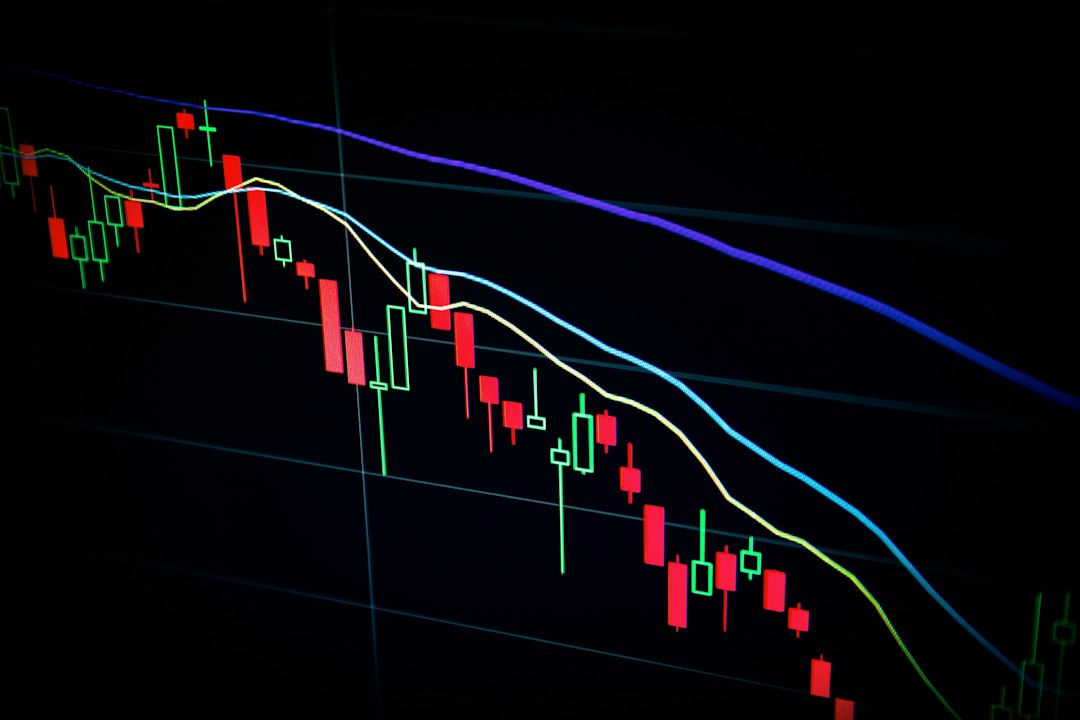
Price charts for gadgets are simpler than stock charts, so there are only a handful of shapes worth knowing. When I look at one, I am hunting for these.
The flat floor. A price that has touched the same low three or four times is telling you what the seller is willing to accept. If today’s “deal” matches that floor, it is a real deal. If it sits well above it, you are looking at a sale that is not much of a sale.
The spike before the dip. A sharp jump in the weeks before a sale, followed by a drop to roughly the old price, is the slow-motion markup. The chart makes it obvious. The tag does not.
The staircase down. Prices that step down every few months and never climb back are products in their final act. They tend to hit their lowest prices as stock clears, which is why previous-generation models are often the smartest Black Friday buys.
The jagged saw. A product that bounces between two prices every couple of weeks is on a rolling promotion. You do not have to buy on Black Friday, because the same price will probably come around again in December. That is a patience-friendly chart.
Picking a target price instead of a feeling

An alert is only as good as the number you give it. Here is the rule I use: set the alert at or just under the lowest price from the last ninety days, and treat the all-time low as a bonus rather than a requirement. Chasing the absolute bottom is how people end up not buying a perfectly good product for six months.
If a product has been on the market for less than a year, give yourself more slack and aim for about ten percent under its typical price. If it is new and has never been discounted, the honest answer is that Black Friday may not move it at all. That is useful information too, because it tells you to buy on your own timeline instead of waiting for a discount that history says may never come.
Alerts also solve the biggest practical problem with Black Friday, which is attention. Prices move in the middle of the night, deals sell out within hours, and nobody is refreshing a product page at 3 a.m. Let the phone do it. When the notification arrives, you already know the price is good, so the only decision left is whether you still want the thing.
Headphones: where the chart earns its keep

Headphones are the category I trust price history for most, because they have long product lives and frequent promotions. The over-ear class I keep watching is Sony WH-1000XM5. It is not the newest model anymore, and that is exactly why its chart is useful: you can see every promotion it has had, which makes a fake discount easy to spot. I walked through who should buy it versus the earbud rival in my XM5 versus AirPods Pro 3 comparison.
For iPhone owners, Apple AirPods Pro 3 are newer, so the chart is shorter and the discounts historically smaller. My rule there is a target roughly ten percent under the typical price, and no panic if it never hits. Anyone who simply wants good noise canceling for less should check Anker Soundcore Space One, which tends to sit at a lower base price and drops further during big sale weeks.
Storage and desk gear: patience pays here
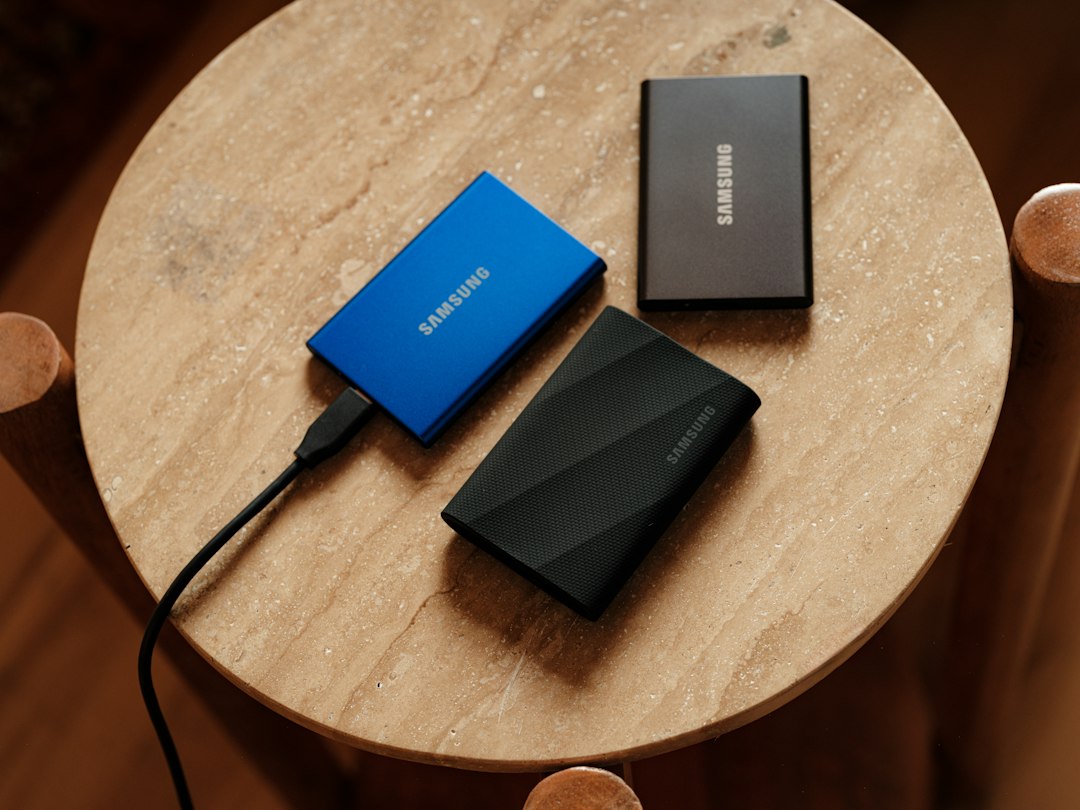
Portable drives are a rare corner of the storage market where I will still hunt for deals, partly because the shortage hits bare internal drives hardest. A rugged external like the Samsung T7 Shield Portable SSD has a few distinct price levels over the year, and the chart makes it clear which one is a bargain. If it is sitting well above its three-month typical price, wait. If you are building a tower and wondering whether to buy storage now, I covered the math in the half-full tower piece.
Desk peripherals are my favorite quiet bargains. The Logitech MX Master 3S and Logitech MX Keys S both show a steady pattern of promotional prices through the year, so a Black Friday number is only exciting if it breaks below those floors. A good wall charger is the other staple. The Anker 735 Charger (Nano II 65W) charges a laptop and a phone from one outlet, and it is exactly the kind of accessory that bounces between a couple of prices all year.
Amazon’s own devices are the chart’s easiest wins
If you want a rule of thumb that nearly always holds, here it is: Amazon discounts its own hardware harder and more predictably than almost anyone discounts anything else. The Fire TV Stick 4K Max, the Echo Dot and the Kindle Paperwhite all have price histories that show repeated deep dips around big sale events. For those, a target at or just under the previous low is realistic, and the deals often arrive early.
The flip side is that these products are discounted so routinely that the “regular” price on the tag is nearly always inflated. Do not take a 40 percent off sticker at face value. Look at what other people paid last month.
The traps a chart will not catch on its own

Price history is powerful, but it has blind spots, and Black Friday is built to exploit them.
First, check who is selling. A great number from an unknown marketplace seller is not the same offer as the one from Amazon or the manufacturer. The chart usually shows both lines separately, so use that. Second, check the exact model. Retailers love “Black Friday editions” with slightly different specs, and the chart for the standard model will not match. Third, watch the condition. Used and renewed listings can quietly slip into the price you are looking at. Fourth, confirm shipping dates: a price that arrives after the holiday you bought it for is not a deal.
I also keep a short list of “do not wait” items, which is the opposite case. If a chart shows a product has never dropped meaningfully and you need it, buy it. Time you spend hunting for a mythical discount is time you are also not using the product. The chart is there to inform you, not to turn you into a person who never buys anything.
A calm plan for the next three weeks

Black Friday lands on November 27 and Cyber Monday on November 30, which leaves you a little over two weeks to get organized. This is how I would spend that time.
- This week: Build your watchlist. Write down the five or six things you actually need, add them to the tracker and note each one’s three-month typical price and one-year low.
- Next week: Set alerts at your targets. Decide in advance what you will spend, and stick to it.
- Black Friday week: Buy only what hits its target. Ignore the rest, even if the banner says the clock is running out.
- Cyber Monday and after: Anything still above your target can wait. Rolling promotions usually come around again before the holidays.
- Before you check out: Confirm the return window and the delivery date. A deal that cannot be returned or will not arrive in time is not much of a deal.
The point of all of this is not to squeeze every last dollar out of November. It is to walk into the busiest shopping stretch of the year with a number in your head, so when someone flashes a big red percentage at you, you can calmly check the chart, shrug, and move on. Most of the time the best deal is the one you quietly skipped.
I will keep watching these prices through Cyber Monday, and my team will flag anything that does something genuinely unusual. If you want one habit to take away, make it this: no chart, no checkout.